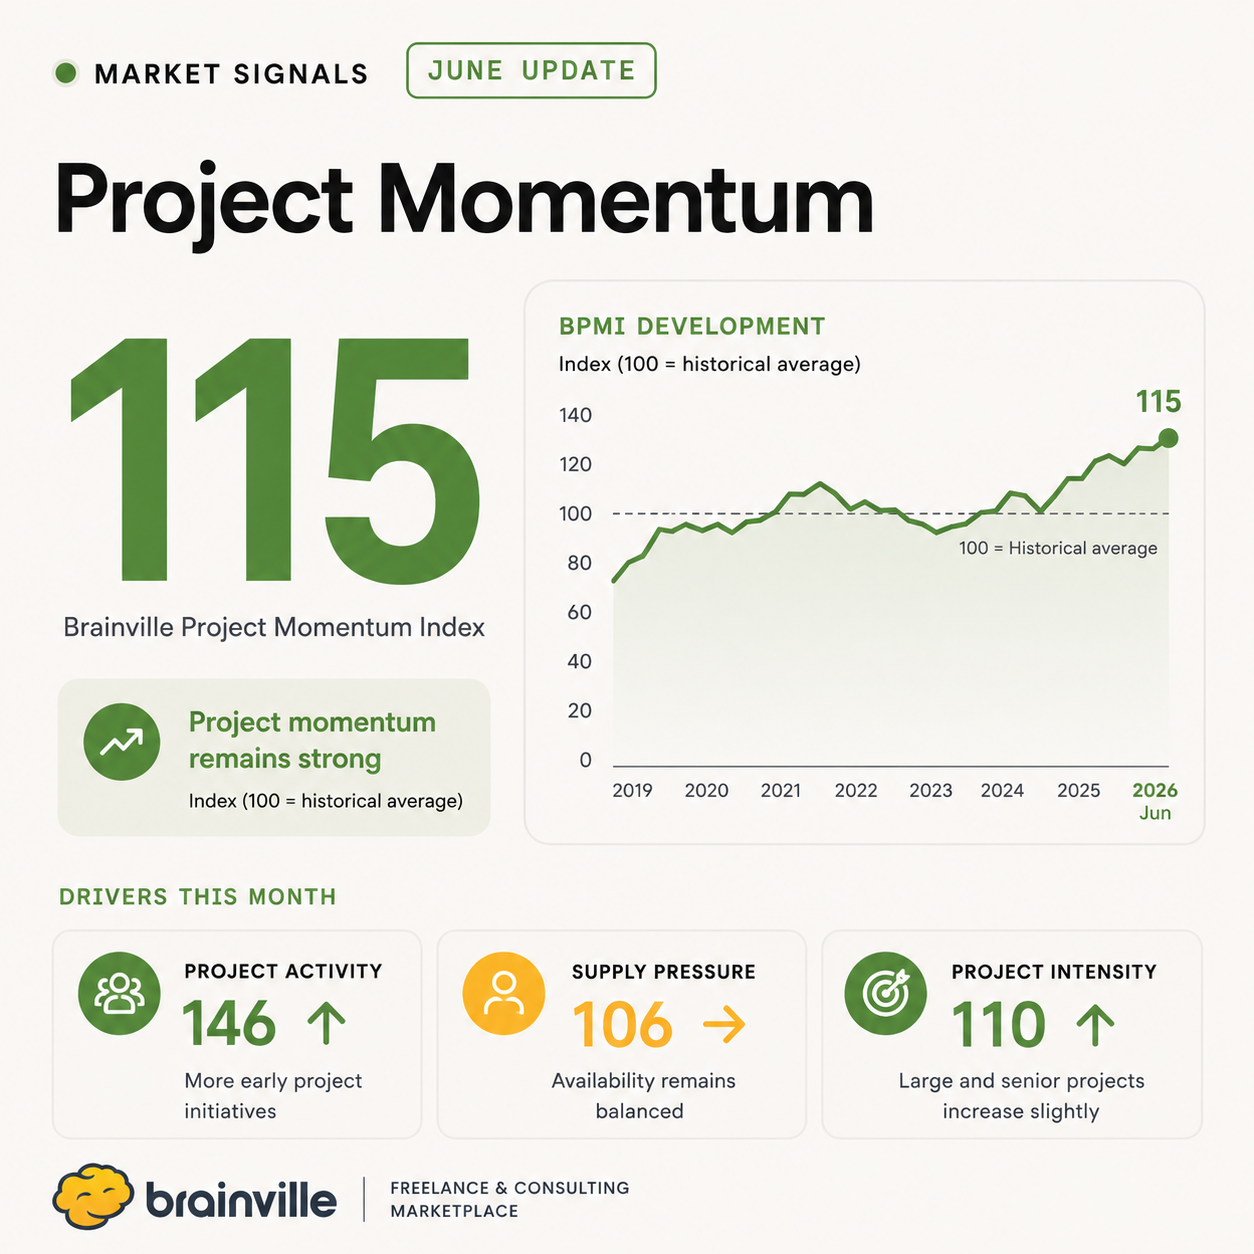
Can we spot the consulting market's next move a little earlier?
Introducing Brainville Project Momentum Index 2.0
How early can we actually see that the consulting market is starting to turn?
I have been thinking about that question for quite some time.
About six months ago, I introduced the first version of the Brainville Project Momentum Index (BPMI). It was based on a simple idea: new projects often follow a pattern where some roles are needed early, while others enter later.
If that is true, early project roles may tell us something about where the market is heading.
Since then, I have continued to develop the model. BPMI 2.0 is the result.
I still do not know whether the model will work as well as I hope. But I think the idea is worth testing, and I hope we can develop it together.
BPMI signals that project activity continues to strengthen. If the model works as I hope, it may point to increased demand for delivery-oriented roles during the autumn.
Projects evolve in stages
Projects are rarely built all at once. First, organisations need people who help define the initiative and make decisions. Then the solution is developed. Only after that does the need grow for developers, testers, integration specialists, DevOps and other delivery-oriented roles.
When we analysed Brainville's data, we saw that early project roles often started moving before the rest of the market.
Can early project roles provide an early signal of where the consulting market is heading?
Three signals
Project Activity
What share of the market consists of roles that usually enter early when new projects start?
Supply Pressure
What share of assignments receive few or no applications?
Project Intensity
How large and competence-intensive do the projects appear to be?
The three signals are combined into BPMI: 40 % Project Activity, 35 % Supply Pressure and 25 % Project Intensity.
The base period is 2019–2025, where 100 represents the historical average. In other words, 100 is not a target – it is simply the average level during the base period.
What does BPMI measure?
- New project initiatives
- How difficult projects seem to be to staff
- How extensive projects appear to be
What does BPMI not measure?
- Market size
- The number of consulting assignments
- The future
Monthly follow-up
My ambition is to follow up BPMI every month in my market updates. In addition to the index itself, I will show the three sub-indices and explain what drove the monthly change.
The goal is not only to describe that the market is changing, but also why.
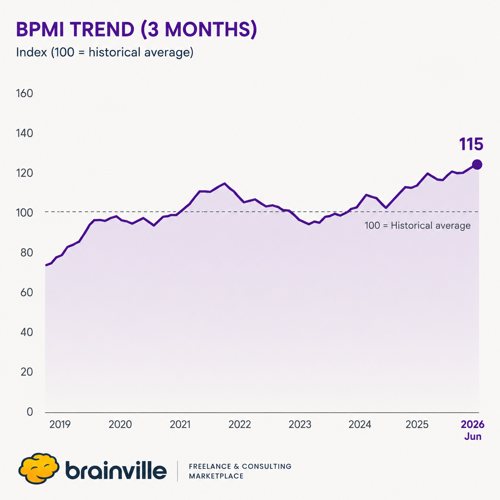
BPMI Trend (3M). 100 represents the historical average during the 2019–2025 base period.
Limitations
No model is perfect, and BPMI is no exception.
Since 2019, areas such as data engineering, cloud platforms and generative AI have grown significantly, while new specialist roles have also emerged.
To reduce that effect, we measure Project Activity as a share of all published assignments, not as an absolute number.
That makes the model more robust, but not immune to changes in the market. BPMI should therefore be seen as a transparent attempt to capture early signals – not as an exact scientific measure.
What does BPMI signal right now?
BPMI signals that project activity continues to strengthen.
The main difference compared with a year ago is that the increase is primarily driven by Project Activity. If the model works as I hope, it may lead to increased demand for developers and other delivery-oriented roles during the autumn.
Whether that actually happens remains to be seen. These are exactly the kinds of patterns I hope BPMI can help us understand a little earlier over time.
This is only the beginning
I do not see BPMI 2.0 as a finished model. I see it as the next step.
The hope is that it will improve with every version while giving us a clearer picture of how the consulting market is developing.
For me, that is what BPMI is really about.
For me, that is what BPMI is really about.
Not trying to predict the future. But understanding it a little earlier.